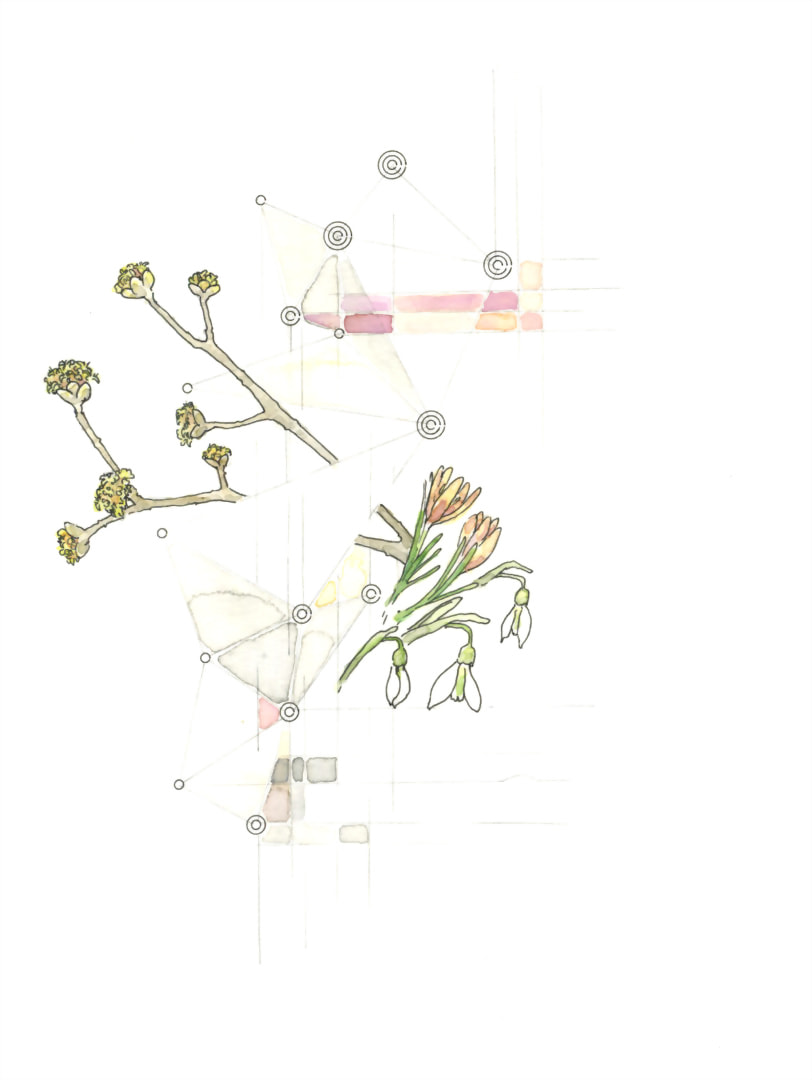
In this small series, I worked with the axidraw pen plotter and Processing to imagine the new growth happening in early spring in Central Park.
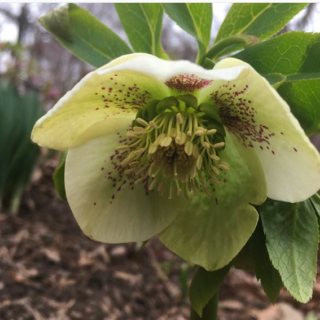
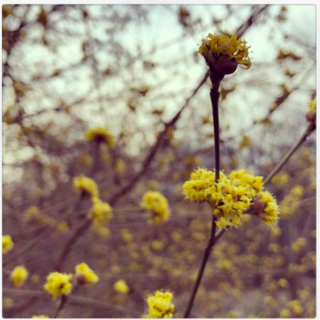
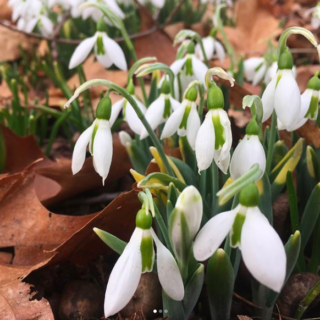
From the warmth of my room, I researched March weather data in Central Park as well as geotagged posts of spring flowers, outsourcing my reference-gathering to the data of others.


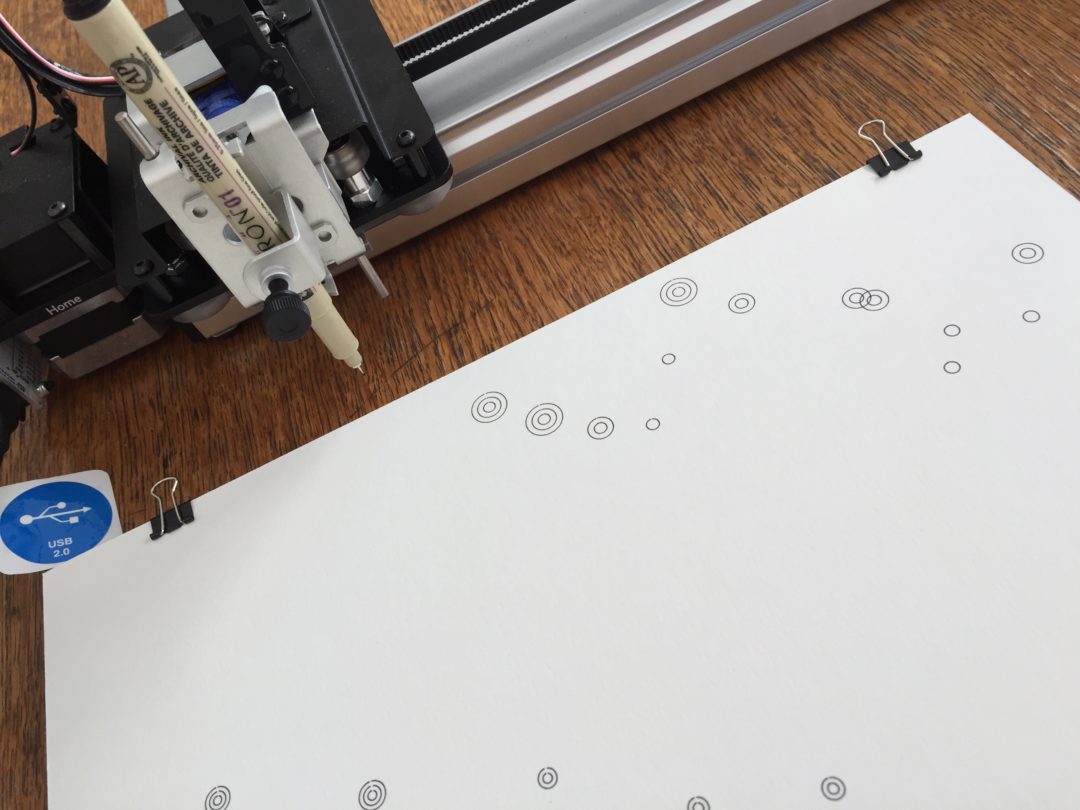
I made some simple plots of the weather data using Processing, comparing humidity and temperature by date and plotting the points as small circles.
Cloud cover was additionally represented by adding rings around the circles (the rule was to add one extra ring if cloud cover was between 30% and 60%, two if it was anything over 60%).

With the axidraw, I could then draw the plots accurately and precisely using waterproof artist’s pen directly onto watercolor paper.
I drew lines to create dimensional relationships between the data points, and then “grew” the flowers I’d been researching from home out of the spaces between the data points.
The data formed a “garden” to situate the flowers, and their pattern was dependent on its form, as with the growth anticipated in the season.
The data forms them and gives a structure to their layout, just like the forces represented by that data enable the form of our gardens year over year.